The Hermon Dunlap Smith Center for the History of Cartography
Narratives and Maps:
Historical Studies in Cartographic Storytelling
Based on the exhibit at the Newberry Library prepared to accompany
the Thirteenth Kenneth Nebenzahl, Jr., Lectures in the History of Cartography.
Each of the maps in this exhibit has a narrative aspect. Though diverse in appearance, content, and function, each is employed, either explicitly or implicitly, in telling a story. Some of these stories are fictions, and in one instance the geography depicted is entirely imaginary. Others relate specific historic events or narrate history on a grand scale. Still others explore terrain narratively and sequentially in the same way that a traveler experiences space, in the order dictated by his or her route and the passage of time. Cartography frequently utilizes textual annotations or works in tandem with accompanying pages of text that flesh out its narratives. Many of the maps on display here, however, rely primarily on graphic devices and effects to set scenes and to represent movement and change. Whether these pictures are truly each worth a thousand words is for you to decide.
Abraham Ortelius, “Argonautica,” in Parergon; sive, veteris geographiae aliquot tabulae (London, 1606). Edward E. Ayer Collection.
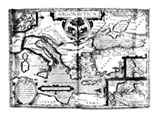 The Parergon (“additional ornament”) was the first historical atlas, begun as a supplement to the 1579 edition of Ortelius’s world atlas, the Theatrum orbis terrarum. The maps of the Parergon illustrate the Greek, Roman, and Egyptian worlds, as well as the mythical past, and were the result of Ortelius’s own research (all the modern maps in his atlas were the work of other cartographers). In extensive texts on the versos of the maps, Ortelius summarizes the events depicted and describes his sources. For the voyage of Jason, he accepts the pseudo-Orpheus account that takes the voyagers north, up the Don, to the Arctic and Atlantic Oceans and back to the Mediterranean through the Pillars of Hercules. Like the ancients, Ortelius accepts the voyage as historical fact, rendered more obscure, but no less believable, because of mythical accretions.
Thomas Page, A Plan of the Action at Bunkers Hill, on the 17th of June 1775 (London: William Faden, 1775). General Collection.
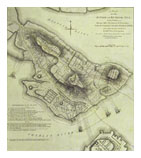 The inherently fluid disposition of troops on a battlefield has always been a challenge to cartographers. A common solution is a series of maps showing the situation at different times. Page’s plan of the Battle of Bunker Hill, however, employs a novel flap, enabling him to show, with a kind of animation, both the initial movements of the British troops (in red, on the flap) and their final taking of Warren’s Redoubt (on the map proper). But reading between the lines of the “References” we see that the narrative, like the battle itself, is ambiguous. Part of the “Rebel Defences” proved “Musket proof,” and one group of infantry “had not been able to force the enemy.” In fact, although the British took the hill and occupied Boston, the Americans proved spirited fighters and twice drove back Howe’s best troops. Despite the loss, American morale rose.
John Ogilby, Britannia…or, an Illustration of the Kingdom of England and Dominion of Wales by a Geographical and Historical Description of the Principal Roads thereof (London: the author, 1675). General Collection.
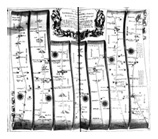 John Ogilby’s book of the roads of England and Wales has been called “the founding publication of a distinctive genre,” the modern road atlas. The particular genius of the strip map format Ogilby adopted is that it narrates every stage of a particular route, pointing out each landmark and crossroad along the way, keeping track of the miles passed, and even commenting on the nature of the countryside. Here, we are looking at the second of two plates showing the way from London to Norfolk. Ogilby intended the atlas to form part of an ambitious English Atlas of the entire world. That plan called for a companion atlas of English counties modeled after those of Christopher Saxton and John Speed that was never completed. The result was a single volume that graphically emphasized pathways of movement throughout the country instead of its local divisions, at a time when domestic travel for business or pleasure was increasing rapidly.
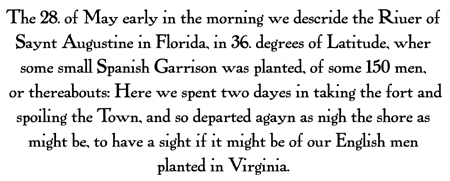
Baptiste Boazio, The Famouse West Indian Voyadge made by the Englishe fleete of 23 shippes and barkes… (London, ca. 1589). Edward E. Ayer Collection.
If the narrative of Jason’s voyage was encrusted with myth, Sir Francis Drake’s 1586 raid on Spanish settlements in the New World was still a fresh memory when this map was published (it would have appeared sooner, but the Armada intervened). The cartographer Boazio also made maps of the four towns which Drake pillaged and ransomed (Santiago in the Cape Verdes, Santo Domingo in the Dominican Republic, Cartagena in Colombia, and St. Augustine, Florida). There is some evidence that Boazio may have been along on the voyage; in any event, the immediacy of the map narrative is enhanced by the texts which accompany them in some copies. The text for this map consists of excerpts from Drake’s log, and includes this laconic account:
Cristoforo Buondelmonte, Incipt liber Insularum Arcipelagi (manuscript, Italy, ca. 1450), Collection of Kenneth Nebenzahl.
 Books of islands (isolarii) were a popular literary form in Renaissance Italy that combined maps of islands with geographical and historical text. Buondelmonte’s maps and lively text, originally composed around 1420 for his patron, became a best seller of sorts in Italy. More than 60 manuscript copies survive, and printed copies and enlargements of his concept were published until the end of the seventeenth century. The Buondelmonte manuscripts consisted of about 70 maps of islands and port cities and text that form a tour of the Archipelago. The copy here includes a fine map of Constantinople a few decades before its Ottoman conquest.
Benedetto Bordone, Isolario (Venice, 1534). Edward E. Ayer Collection.
 Benedetto Bordone’s Isolario greatly extended the geographical range of the concept by adding maps of islands from all over the world. This copy of the second edition is opened to Bordone’s maps of the Caribbean islands of Guadalupe and Martinique. Although each map is oriented by means of an eight-point compass rose, the maps are concerned with evoking the landscape of the islands rather than with navigation.
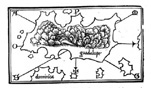
Anon., “Olissippo quae nunc Lisboa, civitas amplissima Lusitaniae,” in Georg Braun and Franz Hogenberg, Civitates orbis terrarum (Cologne, 1572-1618), v. 5 (ca. 1598). Edward E. Ayer Collection.
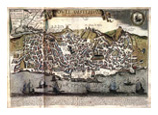
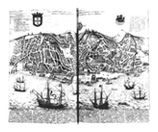 The great success of Ortelius’s “theater of the world” inspired the Cologne publisher Braun to undertake a collection of the world’s cities. Like the Theatrum, the Civitates has extensive texts on the verso of the plates, which are themselves more narrative than most maps. Many of the cities are shown as views rather than planimetric maps, with the additional ability to show the costumes and employments of the inhabitants. The distant perspective of this view of Lisbon reduces people to tiny specks, but there is plenty of evidence of maritime trade and shipbuilding [left image]. The 140 numbered references provide a detailed gloss to the public buildings and spaces. But like any other narrative, maps can lie. Seventy-five years after the engraving of this plate, a French publisher, sensing a demand for a view of the bustling little town of New Amsterdam in America, made a slavish copy of the Lisbon view, renaming the Tagus the “Mer du Nort” (Atlantic) [right image]. The medium was the message.
Madeleine de Scudéry, Map of Tenderness, in Clelia (London, 1678). General Collection.
 Allegorical maps depicting courtship and love as a journey or exploration enjoyed a measure of popularity in French novels during the seventeenth century, in part because of public interest in and familiarity with maps. Perhaps the best known of these maps was Madeleine de Scudéry’s Carte du Tendre, first published in 1654 in her romantic novel Clelie, and shown here in an English translation. The map details the distractions and pitfalls—depicted as town and landmarks—that lovers encounter along their journey from New Friendship (the town at the bottom center of the map) to intimacy.
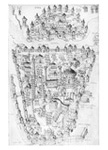
Aztec Mapa de Sigüenza. (manuscript copy 1831, original ca. 16th century). Jean Frederick de Waldeck Collection.
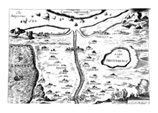
![[Nahautal glyph map of Aztec migration from Aztlan to Tenochtitlán]](/smith/exhibits/narrativesmaps/images/siguenza-th.jpg "[Nahautal glyph map of Aztec migration from Aztlan to Tenochtitlán]") Part map, part graphic history, the Mapa de Sigüenza depicts the migration of the Aztec peoples from their traditional hearth in Aztlan, generally supposed to be in northwestern Mexico and represented here by the rectangle of water at the upper right. The Aztec exodus probably began at the end of the ninth century and lasted several hundred years. Their route (shown by the traditional footprint symbol) is highlighted with glyphs for particular places and events. They tarried for some time at the mountain of Chapultepec (“grasshopper hill”) which lies in the center of modern Mexico City. Finally, in about 1325, they settled at Tenochtitlán in the Valley of Mexico, symbolized by the cactus near the middle of the marshy area at lower left. Here they were to live and prosper for two hundred years before being incorporated into the narrative of Spanish conquest.
Part map, part graphic history, the Mapa de Sigüenza depicts the migration of the Aztec peoples from their traditional hearth in Aztlan, generally supposed to be in northwestern Mexico and represented here by the rectangle of water at the upper right. The Aztec exodus probably began at the end of the ninth century and lasted several hundred years. Their route (shown by the traditional footprint symbol) is highlighted with glyphs for particular places and events. They tarried for some time at the mountain of Chapultepec (“grasshopper hill”) which lies in the center of modern Mexico City. Finally, in about 1325, they settled at Tenochtitlán in the Valley of Mexico, symbolized by the cactus near the middle of the marshy area at lower left. Here they were to live and prosper for two hundred years before being incorporated into the narrative of Spanish conquest.
Edward Quin, An Atlas of Universal History in a Series of Maps, New Edition (London and Glasgow: Richard Griffin, 1856). General Collection.
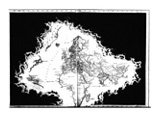 Many editors of early historical atlases narrated historical change simply and effectively by using the same base map repeatedly throughout the book. Few used this technique to greater dramatic effect than Edward Quin in his historical atlas of the world, which was first published in 1830. The 21 maps in the atlas each show the world “as known at different times” to “geographers and statesman” in history—by which he implicitly meant Western geographers and statesman. In the initial plate, showing the world immediately after the Deluge, the dark clouds of geographical ignorance cover everything but Mesopotamia. As one pages through the atlas, the clouds gradually clear, successively revealing southern Europe and North Africa, then Northern Europe and the balance of Asia, and finally all of Africa and the Americas to the daylight of science. This plate depicts 1498, or “The Discovery of America.”