Nadya Kate Engler
Newberry Library Ayer MS Map 1 (f 21v)
 This hand-drawn map illustrates part of a four-volume cosmological poem, La Sfera, produced in Italy in the early Renaissance. Scholars disagree about the identity of the author and illustrator: Florentine Dominican Leonardo Dati (1360-1425) or his brother, a businessman, Gregorio (Goro) Datis (1363-1436). Throughout the work, there are astronomical, meteorological, and geographical images of the world and careful representations of the Mediterranean coastline integrated into the text.
In this map, Jerusalem is located centrally, and appears as a stylized, walled city dominated by a cross, and presiding over a barren landscape. The map renders Jerusalem recognizable to Europeans, and claims it as a Christian center. Whether or not this map is derivative or an example of period portolan charts (coastal navigation plans), the detailed depiction of the coastline with its measured distances between towns is further indicative of the European political, religious, and economic interest in what we now term the Middle East, beginning during the Crusades and continuing even today.
Gene Brucker, ed., Two Memoirs of Renaissance Florence: The Diaries of Buonaccorso Pitt and Gregorio Dati (New York: Harper and Row, 1967).
J.B. Harley and David Woodward, eds., The History of Cartography, Volume One: Cartography in Prehistoric Ancient, and Medieval Europe and the Mediterranean (Chicago: University of Chicago Press, 1987).
Kenneth Nebenzahl, Maps of the Holy Land: Images of Terra Sancta through Two Millennia (New York: Abbeville, 1986).
Imagining Hungary
Jennifer Grek
Newberry Library Ayer Collection.
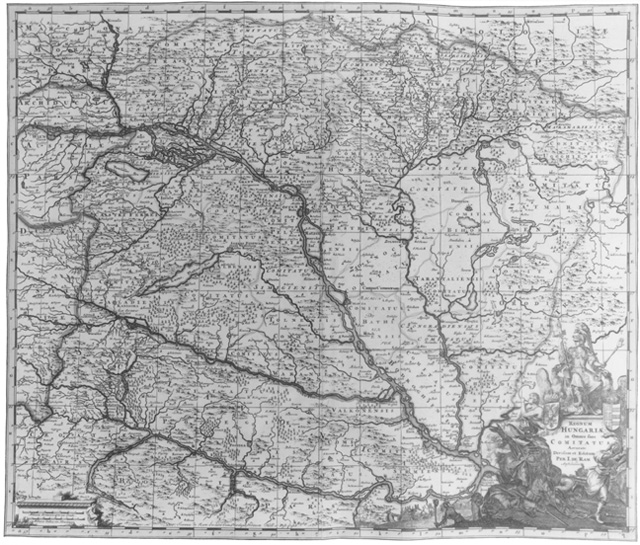 Due in part to its importance in world trade, Amsterdam became the center of European world atlas production during the seventeenth century. Frederic de Wit’s Atlas, typical of most Dutch atlases, reflects the ambiguities of popular Western European views of Eastern Europe during this time.
The kingdom of Hungary was always represented spatially as part of the continent of Europe. However, the cultural depictions of Hungary differed markedly, and inconsistently so, from that of the Western European powers. While the cartouches of England and Holland depict scenes of cherubic mirth, the menacing cartouche seen here symbolizes Hungary as a place of conflict and violence. While instruments of cartographic measurement adorn maps of western political regions, Pan guards the scale bar of Hungary, an indication of uncertainty and ambiguity. The inconsistent spatial placement and cultural connotations of images of Eastern Europe in seventeenth century atlases suggest an unsolidified view of this world region among Western Europeans.
Larry Wolff, Inventing Eastern Europe: Mapping Civilization on the Mind of the Enlightenment. (Stanford: Stanford University Press, 1994).
Maria Todorova, Imagining the Balkans (New York: Oxford University Press, 1997).
The Map as Historical Narrative
Jenni Heim
Newberry Library oversize Ayer Art Waldeck box E-1 no. 21
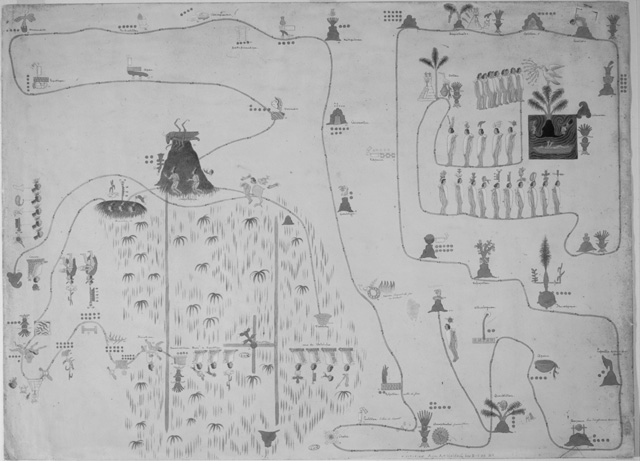
 This map is a sixteenth-century cartographic history painted in the early Spanish colonial period to transmit Aztec imperial history and identity in relation to other mesoamerican peoples. Although possibly influenced by Europeans, it is within a tradition of indigenous documentation and representation. Heiroglyphs present the essential elements of a story which would also have been narrated orally.
The migratory story of the Aztecs starts in their island home of Aztlan (green hill in the square), and proceeds to Tenochtitlan (the nopal cactus at the crossed canals). The initial part of the narrative presents space sequentially. A footprinted path indicates movement through time and space from site to site. Entering the Valley of Mexico near Chapultepec (the Hill of the Grasshopper), however, the story takes a dramatic turn. To emphasize the importance of this moment, the map’s orientation shifts and readers must turn the painting upside down, or move themselves to continue. The map now shows a great attention to detail concerning relations between Aztecs and other groups, particularly bloody deaths of named individuals and further retreat into the marshy lake. Topographical elements are also depicted with greater precision, tying events to specific places and landscape. Geographic space is now presented, with various towns located on the map as they are located in relation to one another on the ground. The history ends at the moment the Aztecs founded Tenochtitlan—the city that will become the center of their empire and their world.
Elizabeth Hill Boone, “Maps of Territory, History and Community in Aztec Mexico,” in G. Malcolm Lewis, ed., Cartographic Encounters (Chicago: University of Chicago Press, 1998), pp. 111-13.
Elizabeth Hill Boone, “Aztec Pictorial Histories: Records without Words,” in Writing Without Words: Alternative Literacies in Mesoamerica and the Andes (Durham, NC: Duke University Press, 1994), pp. 50-76.
Dana Liebsohn, “Primers for Memory: Cartographic Histories and Nahua Identity,” in Writing Without Words: Alternative Literacies in Mesoamerica and the Andes (Durham, NC: Duke University Press, 1994), pp. 169-87.
Luctor et Emergo: “I Fight to Emerge”
Lisa Davis-Allen
Newberry Library General Collection.
 The depiction of the Netherlands as a lion was first introduced in map form by Michael von Aitzing in 1579, and was quickly embraced by European cartographers throughout the seventeenth century. Specifically, the symbol reflected the Dutch struggle for freedom from Spain and the Habsburg Empire. Ultimately developed in four versions, cartographers included various provinces, identifying them as Leo Belgicus and Leo Hollandius.
In 1632 Famiano Strada, a pro-Spanish Jesuit, incorporated the lion map into a two-volume history on the Netherlandish War of Independence. This particular 1648 edition (one of eight) was probably copper engraved in the Netherlands. It reveals the strength of the provinces and its role as a formidable enemy for the Spanish crown. Originally found in medieval heraldic form throughout Europe, the lion rampant personifies the Dutch Republic’s strength of character, evident in the lion’s bared teeth and its raised right foreleg. With tail erect and encircling a compass rose, the figure reflects the pride of the Dutch and their ability as a maritime power.
H.A.M. van der Heijden, Leo Belgicus: An Illustrated and Annotated Carto-Bibliography (Alphen aan den Rijn: Canaletto, 1990).
R.V. Tooley, Leo Belgicus: An Illustrated List of Variants, Map Collector’s Series no.7 (London: Map Collectors’ Circle, 1963).
Imaging Power Through Commerce
Lisa Davis-Allen
Newberry Library Visscher Collection
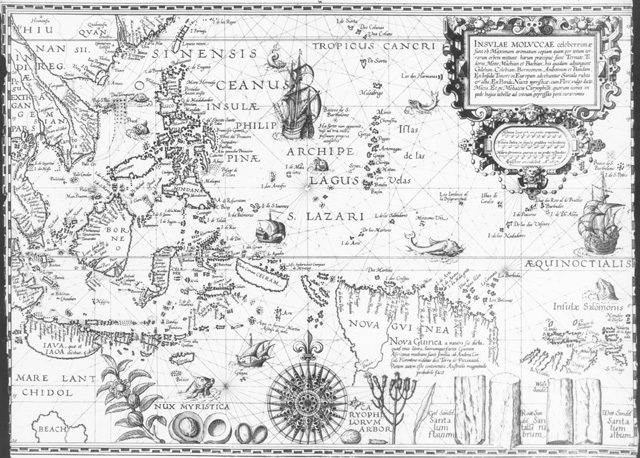 Maps relating to Dutch exploration and overseas trade dominated the European market during the late sixteenth and seventeenth centuries. This skillfully engraved map of the Spice Islands, originally produced in manuscript form by Portuguese chartmaker Bartholomeu de Lasso, was subsequently published by the Dutch between 1592 and 1619.
This elaborately decorated edition, probably engraved by Johannes Doetecum, was not only a practical navigational tool, but also expressed the Dutch East India Company’s commercial prowess in the region. Geographical information is concentrated in the port areas, giving little or no indication of interior colonization. Both text and decorative elements described the abundance of natural resources that were available for European consumption. Added images of nutmeg and sandalwood reinforced the Dutch penchant for describing, while the prominent Dutch fluijts (ships) laid claim to the surrounding seas.
Svetlana Alpers, The Art of Describing: Dutch Art in the Seventeenth Century (Chicago: University of Chicago Press, 1984).
James R. Akerman, David Buisseret, and Robert W. Karrow, Jr., Two By Two [exhibit catalog] (Chicago: The Newberry Library, 1993).
Charles Pickering, Chronological History of Plants: Man’s Record of His Own Existence Illustrated Through Their Names, Uses, and Companionship (Boston: Little, Brown, & Co., 1879).
Kees Zandvliet, Mapping for Money: Maps, Plans, and Topographic Paintings and Their Role in Dutch Overseas Expansion During the 16th and 17th Centuries (Amsterdam: Batavian Lion International, 1998).
Routes of Society
Erin C. Blake
the Borough of Southwark, with the Country about It (London, 1748), sheet XI.
Newberry Library General Collection.
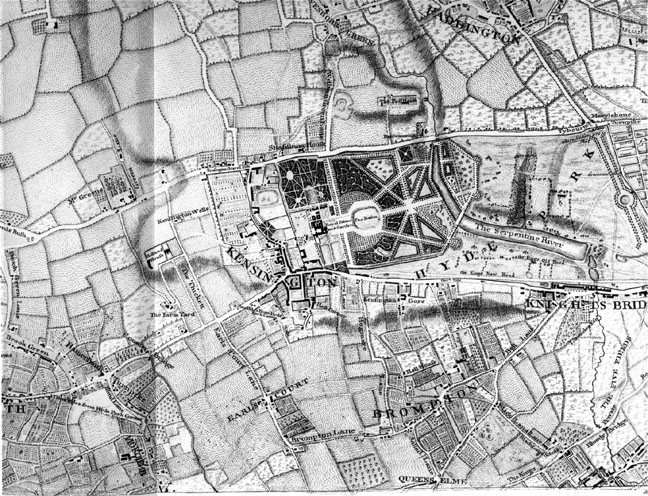 Although Rocque’s map of greater London promises to be “of General use to all Persons who have Occasion to Travel round this Metropolis for Business, Health, or Pleasure,” the expensive volume is too big to use while travelling. Instead, it provided wealthy readers at home with a particular view of their capital city, one which helped them see themselves as the embodiment of the nation at a time when England’s center of power was shifting away from the monarchy towards these self-styled members of “polite society.” For such men and women, reputations rested not only on birth and land holdings, but also on business fortunes, cultural achievement, and social skill. They gathered around the card table at Holland House, home of Caroline and Henry Fox (on the crease of this sheet). They strolled together beside the Serpentine in Hyde Park (on the right). In short, they moved easily amongst the houses, parks, public buildings and villages which this sixteen-plate map links together.
Jürgen Habermas, The Structural Transformation of the Public Sphere: An Inquiry into a Category of Bourgeois Society, ed. Thomas McCarthy, trans. Thomas Burger with the assistance of Frederick Lawrence (Cambridge, MA: MIT Press, 1989).
David H. Solkin, Painting for Money: The Visual Arts and the Public Sphere in Eighteenth-Century England (London: Yale University Press, 1993).
Our Lady of the Compass Rose
Michael Werner
Newberry Library Ayer Collection.
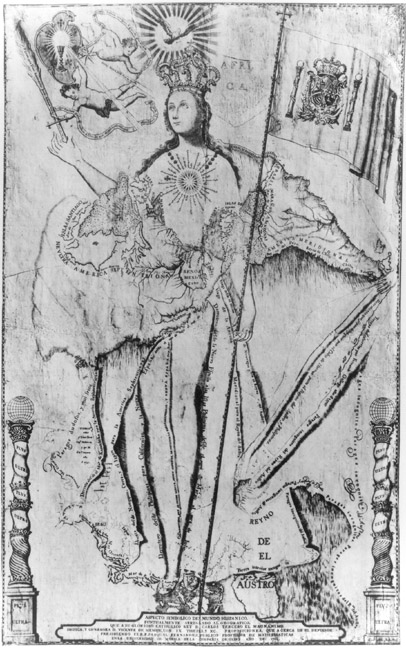 This “symbolic aspect of the Spanish world” was submitted to the Jesuit University in Manila and dedicated to Carlos III of Spain. Printed during a period of heightened rivalry among European powers, at first glance the map seems to be a straightforward assertion of Spanish preeminence. On closer examination, however, it is more remarkable for the ways in which it combines scientific mapmaking, Spanish nationalism, and Catholic piety. The queen, who resembles the Virgin Mary, gazes toward a Star of Bethlehem in the upper left, and the Sacred Heart of Catholic iconography has become a compass rose. Above her crown, Rome is represented as the Holy Spirit—a clear assertion of Church supremacy during a period of escalating conflict between the Jesuit Order and the Spanish Crown.
D. A. Brading, The First America: The Spanish Monarchy, Creole Patriots, and the Liberal State, 1492-1867 (Cambridge: Cambridge University Press, 1991).
Tom Conley, The Self-Made Map: Cartographic Writing in Early Modern France (Minneapolis: University of Minnesota Press, 1996).
A Cold War Map
Darren A. Diviak
Early in the Cold War, State Department officials likened communism to an infectious disease. With this map, R.M. Chapin supplies readers of Time magazine with a visual representation of the contagion metaphor. The map portrays Soviet Russia as a virulent red expanse that infects neighboring states with communist dogma. Chapin divides Russia’s neighbors into three categories depending upon the severity of their infection. “Quarantined” states have completely fallen to communism and are therefore inaccessible to democracy and capitalism. “Infected” states contain substantial communist minorities that allow Moscow to influence public policy. “Exposed” states have extensive social problems, which provide openings for future infection.
Perhaps the most interesting aspect of the map is its unusual split-spherical presentation of Europe and Asia. With the resulting break in the center of the map, Soviet influence seems disturbingly large. Such images undoubtedly bolstered public support for the “containment” of this apparently aggressive disease.
Walter LaFeber, The American Age: U.S. Foreign Policy at Home and Abroad 1750-Present (New York, 1994).
*We are unable to this image in print on the Web. You may find it in your public library in the 1 April 1946 issue of Time magazine.
Playing Games with Maps
Benjamin Stone
Newberry Library map 4F G5751 .A9 1794 .W3
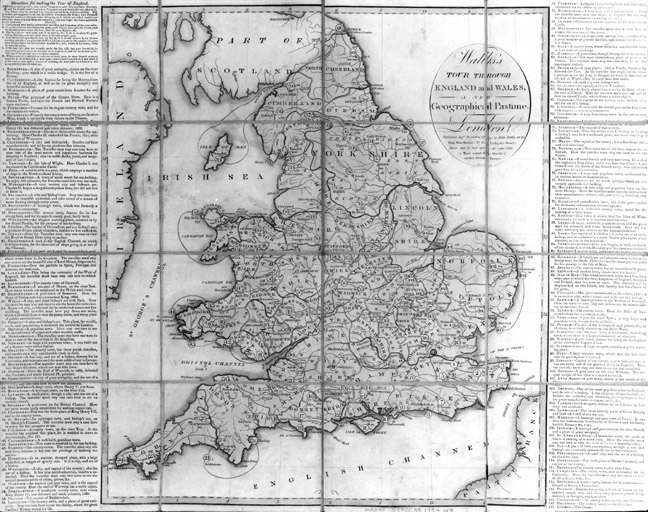 John Wallis’s 1794 Tour through England and Wales: A Geographical Pastime was one of the earliest English games designed to teach children geography. While the French had created similar games in the seventeenth century, late eighteenth-century England witnessed an explosion in the popularity of such map-games. Wallis’s firm, which existed from the early 1780s until 1847, was a leader in the production of such educational games.
Using game pieces, children followed a route around England, while reading descriptions of towns which emphasized the growth of manufacturing and transportation networks, as well as historical figures and events. Wallis’s game familiarized English children with their nation’s geography as well as stressing its early industrial growth.
J.H. Plumb, “The New World of Children,” in Neil McKendrick, John Brewer, and J.H. Plumb, eds., The Birth of a Consumer Society: The Commercialization of Eighteenth-Century England (London: Europa Publications, 1982), pp. 286-315
Linda Hannas, The English Jigsaw Puzzle, 1760-1890 (London: Wayland, 1972).
Mapping Identity and History
Christopher Tassava
Newberry Library Map Collection
This map, by telling part of the little-known history of Finnish colonists in the New World, attempts to create a place for Finns in American history. The prominent cluster of pennants at the map’s center establishes a sense of Finnish presence in America by marking Finnish farmsteads and naming their owners. All around the pennants, other pictorial elements (some bilingual) attempt to connect the Finnish colonists with United States history. For instance, the map claims that William Penn made his famous friendship pledge with the Native Americans of Pennsylvania at a Finnish farm. Published at a time when Finnish-Americans struggled to define themselves as Americans, the map provides powerful assistance, asserting the Finn’s long-standing ties to the land and peoples that, a century after the activities and events shown on the map, became important parts of the United States.
Terry G. Jordan and Matti Kaups, The American Backwoods Frontier: An Ethnic and Ecological Interpretation (Baltimore: Johns Hopkins Uni-versity Press, 1989).
Carl Ross, The Finn Factor in American Labor, Culture, and Society (New York Mills, MN: Parta Printers, 1977).
Carole E. Hoffecker, et.al., eds., New Sweden in America (London: Associated University Presses, 1995).
E.A. Louhi, The Delaware Finns, or The First Permanent Settlements in Pennsylvania, Delaware, West New Jersey, and Eastern Part of Maryland (New York: Humanity Press, 1925).
*We are unable to reproduce this image on the Web.
Mapping a Political Movement
Eric Slauter
Abolition of the African Slave-Trade by the British Parliment (London, 1808).
Newberry Library General Collection
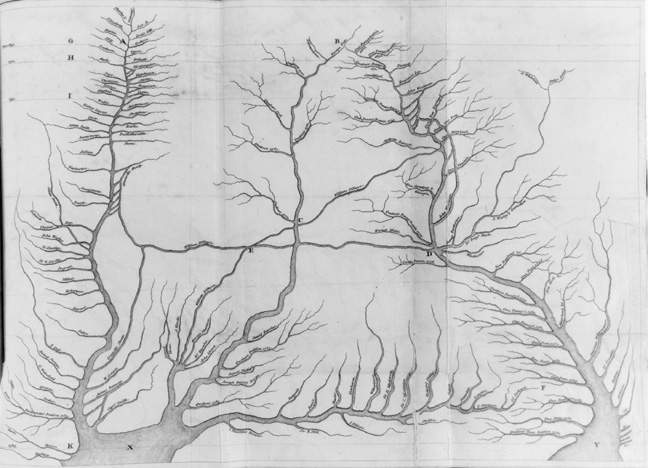 Who overthrew slavery? The prominent British abolitionist Thomas Clarkson (1760-1846) borrowed cartographic imagery to answer this question, offering readers a history of the antislavery movement in a single view. Published to celebrate the legal end of the British and United States external slave trades in 1807, Clarkson’s diagram represents abolitionism as an international movement of writers and groups, a “swelling torrent” of interconnected rivers whose currents could be mapped but not reversed. Clarkson’s emphasis on the philosophical critique of slavery by male writers (including himself – see lower right) and the role of white humanitarianism provided the foundation for an interpretation of the end of the British slave trade that remained dominant for a century and a half. With the aid of recent scholarship, however, we can begin to appreciate how and why Clarkson’s graphic strategy suppressed conflicts among white abolitionists and placed the writings of free blacks and the struggles of slaves themselves literally off the map.
Robin Blackburn, The Overthrow of Colonial Slavery, 1776-1848 (London: Verso, 1988).
David Brion Davis, The Problem of Slavery in the Age of Revolution, 1770-1823 (Ithaca, NY: Cornell University Press, 1975).
Don Herzog, Poisoning the Minds of the Lower Orders (Princeton: Princeton University Press, 1998).
Mapping the British Empire
Anne Hardgrove
Seaports Light Houses and Light-Ships, Periodical Steamship Routes, Head Post Offices,
and Circles," in Trelawney Saunders, An Atlas of Twelve Maps of India (London, 1889).
Newberry Library Eames oversize G 1069 .78
 Railroads were an important tool of empire building. This map, part of a British administrative atlas of colonial India, displays the progress of British railroads, along with roads and other infastructure for transportation and communication. Railroad companies bid to construct railroads for the British at a guaranteed profit, and built railway gauges according to their own convenience. Red lines on the map demarcate the proposed standard gauge-width of 5.5 feet, while green lines reflect gauge-widths of smaller proportions, as small as 2 feet, creating technical problems in shipping both people and freight. The acknowledgement of these variations reflects the expression of individual interests within the project of Empire. The map displays considerable detail of lands bordering India, suggesting how communications networks were linked with adjacent regions, and implying possible future land acquisition.
Daniel R. Headrick, The Tools of Empire: Technology and European Imperialism in the Nineteenth Century (New York: Oxford University Press, 1981).
To Map or Not to Map
David Lion Salmanson
This map was produced by Anglo Richard Van Falkenburgh for his book Navajo Sacred Places and included as part of a 1960s court case to help settle the outstanding land claims of the Navajo tribe against the United States Government under the Indian Claims Commission. The dark black boundary shows the historical range of Navajo settlement while the numbered triangles represent specific sacred sites enumerated in the legend.
In the 1990s, prompted by a different set of concerns, the Navajo Office of Historic Preservation produced a different book, also called Navajo Sacred Places. This book included no detailed maps because revealing the locations might endanger the sites and because the authors thought that locating the places on the map removed them from their cultural context. Instead, the book included large excerpts from Navajo oral histories and origin stories that located places spatially but were impenetrable to outsiders.
Klara Bonsack Kelley and Harris Francis, Navajo Sacred Places, (Bloomington, IN: Indiana University Press, 1994).
*We are unable to reproduce this image on the Web. It is available in David Agee Horr, ed., American Indian Ethnohistory: Indians of the Southwest, vol. 82, no. 1 (New York/London: Garland Publishing Inc., 1974)